


In this S&P 500 Deception Gazette we are pleased to bring to you investment information never before published about the storied equity index, namely:
- Deception And Truth Analysis (D.A.T.A.) Scores which we use to assess the level of deceptiveness and truthfulness in the S&P 500’s 10(k)s and 10(q)s for 2008 thru 2021.
- Normative data about the deceptiveness and truthfulness of the S&P 500, including its average, standard deviation, median, maximums, minimums, and so on.
- Are companies becoming more, or less deceptive?
- Are companies more deceptive in recessionary times?
- The historical distribution of deception and truth in the S&P 500; that is, its shape.
- The consistently most truthful industries.
- The consistently most deceptive industries.
Our Methodology
Before sharing our results you may want to understand the beating heart of our analyses, the D.A.T.A. Score. What the heck is that? A D.A.T.A. Score is a scientific evaluation that measures the degree of psycholinguistic similarity of a document to known psycholinguistic features used by deceivers when communicating. OK, great, but what is psycholinguistics? Psycholinguistics is the revealing of a communicator’s underlying behaviors as revealed through their language use.
Our D.A.T.A. Scores range from -100% to +100% where negative values suggest the degree of deceptiveness and positive values suggest the degree of truthfulness. Specifically, a highly negative D.A.T.A. Score means that there is a high degree of deceptive language present. Likewise, a high positive D.A.T.A. Score means that there is a high degree of truthful language present.
In other words, a D.A.T.A. Score is somewhat like saying that the language used in a document “rhymes” with the language used by those who seek to deceive us using written text.
S&P 500 Deception And Truth Analysis Normative Data
The following normative data is for almost every document published by the S&P 500’s constituent companies in their 10(q)s and 10(k)s 2008 through 2021. D.A.T.A. Scores range between deceptiveness and truthfulness, -100 to +100:

In our premium product DATAREDline we show our Clients the ebb and flow of deceptiveness/truthfulness throughout a document and the specific language associated with each of our D.A.T.A. Scores. Thus, an important consideration is the % of fragments within a document that are assessed as deceptive. After all, it is possible for a document to score, in the aggregate, as truthful, but still contain many sections that are assessed as deceptive.
Here is our normative data on the % of deceptive fragments in the S&P 500 constituent companies’ 10(q)s and 10(k)s 2008 through 2021:

Are Companies Becoming More or Less Deceptive Over Time?
We think it only natural that you wonder if companies in the S&P 500 are becoming more, or less deceptive. Based on an assessment in D.A.T.A. Score trends we believe the answer is: more.
We measured this by examining the slope of the trend in D.A.T.A. Scores (2008 thru 2021), which is -0.14%. In other words, in the aggregate, companies are becoming slightly more deceptive because the slope in the trend of their D.A.T.A. Scores is slightly negative.
A secondary measurement is to look at the slope of the % of deceptive fragments. Here again the answer is that companies are becoming slightly more deceptive, with a slope of 0.08%. In other words, there is an overall trend in companies having a higher proportion of their documents containing deceptive language.
Are Companies More Deceptive in Recessionary Times?
Another question that seems obvious is to ask of our dataset is whether or not companies are more deceptive in recessionary times. After all, most of us do not like talking about our poor performance. Thus, a reasonable hypothesis seems to be that companies would, in the aggregate, be more deceptive in recessionary times.
In our large dataset of D.A.T.A. Scores we have two recessionary periods that we can consider: the Great Recession (1Q 2008 – 2Q 2009) and COVID (1Q 2020 – 2Q 2020) [both: according to Wikipedia]. In the Great Recession we see that companies became slightly more truthful, while in COVID they became much more deceptive.
S&P 500: The Distribution of Deception
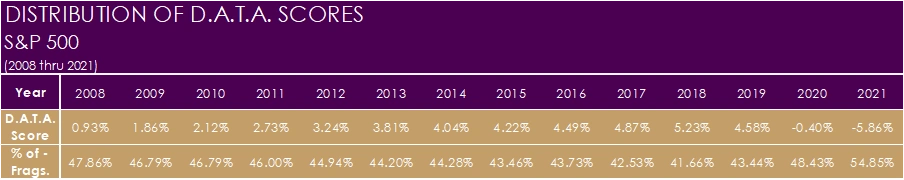
Next up, in terms of interesting insights is the overall distribution of deception and truth over time in the S&P 500. Below is a chart of D.A.T.A. Scores and their distribution from 2008 thru 2021:

As you can see there is a rightward skew in the data. In fact, the skew is 8.67%. Any positive number means a skew toward the right-tail. If you want an idea of what the above distribution looks like each year throughout our dataset, look no further than the main image associated with this article up above.
Crucially, our dataset shows that D.A.T.A. Scores – which we are confident measure truthfulness and deceptiveness – are not normally distributed. Specifically:

Recall from above that the mean D.A.T.A. Score is 2.57% truthful when interpreting the figures above. Total documents being within one standard deviation of the mean number: 79.82%. Documents within two standard deviations of the mean are: 97.42%. Last, fully 99.66% of documents are within three standard deviations of the mean. In other words, truth and deception appear to be platykurtic.
The Most Truthful S&P 500 Industries (2008 thru 2021)
Due to loss aversion, probably most of us are most excited about learning which of the S&P 500’s industries is most deceptive. Bear with us while we first honor those industries that are consistently the most truthful. They are:

The Most Deceptive S&P 500 Industries (2008 thru 2021)
Now we get to the stuff we bet you have been anxiously awaiting: those industries that are consistently the most deceptive. They are:


0 Comments