


In this week’s article we further feature the findings of CloudQuant[i]who independently validated that DATA Scores, in general, are predictive of future small cap stock price movements in their whitepaper, Outperforming the Market with Measures of Deceptive and Truthful Language in Regulatory Filings. Earlier this year we featured similar results for large cap stocks in “Independent Validation: DATA Handily Beats the S&P 500.” For those new to Deception And Truth Analysis, we have built an algorithm based on the findings of deception science which has over the last 100+ years and in 8,000 pieces of research identified behavioral differences between deceivers and truth tellers. We then use Natural Language Processing to look for more than 30 behavioral differences between deceivers and truth tellers.
Our algorithm is grounded in science, not machine learning and it has never seen a stock price. Instead we measure human behavior and it appears to be the case that financial markets are slow to price managements’ behaviors, but that to do so is extremely beneficial to generating excess returns.
In short, CloudQuant identified multiple outperformance strategies based on DATA Scores. In this article we summarize their findings in implementing a small cap strategy. We leave the nitty gritty details to their whitepaper.[ii] Briefly described they found that focusing on small cap stocks whose management teams showed a reduction/improvement in how much high risk, likely deceptive language, was in their annual 10(k) reports, and quarterly 10(q) reports leads to noteworthy outperformance of the DATA small cap strategy versus the Russell 2000.
DATA Handily Beats the Russell 2000: Major Results
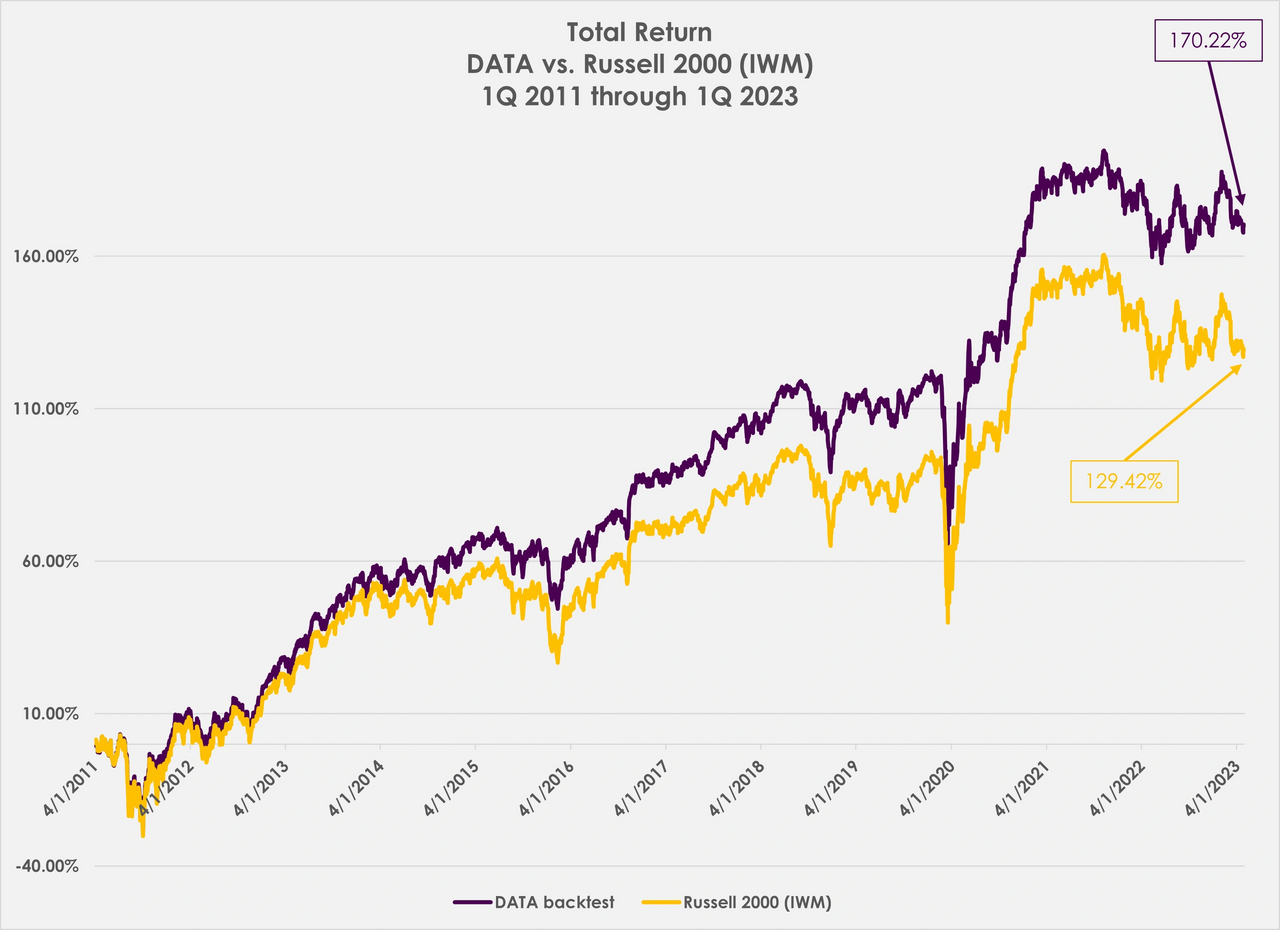
The graph below shows the total return results of CloudQuant’s use of DATA Scores to construct a small cap trading strategy to compete against the Russell 2000, whose ETF equivalent is ‘IWM.’
By Jason A. Voss, CFA
As you can see, the small cap strategy using DATA Scores bests the Russell 2000 over the period 170.22% total return versus 129.42%. The excess return at the end of the period was 40.80%. The maximum total return outperformance occurred on 30 March 2023 with an excess return of 42.83%. Again, as a reminder, the DATA algorithm measures human behavior and has never seen a stock price. The maximum underperformance of the DATA strategy actually took place on the very first day of the strategy, 1 April 2011, at -0.80%.
Further detail of the DATA small cap strategy is shown below where the performance each year is shown, along with the annual excess return of the DATA small cap strategy versus the Russell 2000.

As you can see, above, the DATA small cap strategy appears to be more defensive with outperformance taking place in each of the down years for the timeframe shown. In up years the performance is more mixed.
Additional key details from the head-to-head comparison of DATA versus the Russell 2000 are summarized below:

First, the DATA small cap strategy’s average monthly, quarterly, and annual performance exceeds that of the Russell 2000. These amounts are +0.11% per month, +0.23% per quarter, and +0.56% per year. Not shown in the chart above is the average daily return of the DATA small cap strategy versus the Russell 2000. Outperformance is present there, too: 0.038% versus 0.034%.
Second, the Russell 2000’s maximum return in a month was 21.07% vs. the DATA small cap strategy’s maximum return in a month of 20.73%. This is an underperformance of 0.34%. However, for the quarterly and annual periods, the DATA strategy’s maximum returns exceed those of the Russell 2000.
Third, in terms of Maximum Drawdown, the DATA small cap strategy performs better than the Russell 2000 for the monthly, quarterly, and annual periods. Specifically, the DATA small cap strategy versus the Russell 2000 in its: worst month outperforms by 0.16%; its worst quarter outperforms by 1.47%; and its worst year outperforms by 4.50%. In other words, the DATA small cap strategy preserves capital better than the Russell 2000.
If volatility is your thing, then you will be happy to know that this outperformance is also present when looking at the standard deviation of returns of the DATA small cap strategy versus the Russell 2000 are [not shown in the chart above]: daily returns 1.04% versus 1.12%; monthly returns 3.70% versus 4.05%; quarterly returns 7.51% versus 8.07%; and annual returns 11.24% versus 13.32%.
Next, the returns of the DATA small cap strategy are more consistent than those for the Russell 2000, which we can evaluate by looking at the proportion of months, quarters, and years of outperformance. Here the DATA small cap strategy versus the Russell 2000 shows outperformance in: 80 of 145 months; 30 of 48 quarters; and 9 of 13 years.
If consistency of positive returns is more important to you then the DATA small cap strategy versus the Russell 2000 shows it up: 52.89% versus 52.37% of days [not shown]; 62.07% versus 62.07% of months; 72.92% versus 68.75% of quarters; and 69.23% versus 69.23% of years.
Summary
If you were to invest in the DATA small cap strategy versus the Russell 2000 then you would have outperformed on most days, as well as in most months, quarters, and years. Additionally, from a capital preservation perspective your maximum drawdown would have been better and you would have outperformed the Russell 2000 in each of the four years in which small caps had negative returns. Last, your returns would have been more consistent, meaning that your entry point and exit point are more likely to have generated outperformance.
[i] SolActive has also independently validated the DATA platform with interesting results that will feature in a forthcoming article.
[ii] For those interested in CloudQuant’s methodology we refer you to the whitepaper, pages 23-25.


0 Comments