


In an investment world with any number of potential credit shocks (see our coverage of debt crises in the eurozone, China, Japan, and the United States) and trillion dollar/euro/yen/yuan consequences, a detailed analysis of creditor risk and credit spreads is paramount. Contained within the difference between one asset’s current yield and another’s — holding all else equal — is a plethora of critical information about the differences in risk among debt issuers. Yet risk is a multi-headed beast with many components, including default, liquidity, taxes owed, accounting transparency, exposure to the political business cycle, and unfunded pension liabilities.
Each investor has a unique menu of risk concerns that capture her/his attention, so having a rough idea of what percentages of an average credit spread are typically allocated to the different risk components is potentially very useful to practitioners. Fortunately, housed within the CFA Institute archive is much research separating out the abstruse components of credit spreads.
What follows is a summary of pertinent research on credit spread components.
Default Risk Component
Default risk is clearly among the most important risks for fixed-income investors to consider. Researchers Hai Lin, Sheen Liu, and Chunchi Wu develop a new methodology to better dissect the components of credit spreads and describe their findings in “Dissecting Corporate Bond and CDS Spreads.” They discover that 47% of yield spreads are explained by default risk while the remaining 53% is made up of nondefault risks (additional detail provided later).
Francis A. Longstaff, CFA, Sanjay Mithal, and Eric Neis distinguish default risk from nondefault risk in their paper “Corporate Yield Spreads: Default Risk or Liquidity? New Evidence from the Credit Default Swap Market.” Specifically, they state that default risk accounts for 50–83% of total risk across both private and public debt issues.
Default risk is likely higher in emerging markets and for non-investment-grade issues. In fact, Katia Rocha and Francisco A. Alcaraz Garcia consider the sovereign default risk of emerging market bonds in their paper “The Term Structure of Sovereign Spreads in Emerging Markets.” Non-investment-grade sovereign debt shows a hump-shaped yield curve, whereas investment-grade sovereigns show a more traditional upward-sloping yield curve. That is, spreads are wider at the short-dated and long-dated portions of the curve for non-investment-grade credits. Investors are, therefore, smart to build this into an understanding of sovereign credit spreads.
Liquidity Risk Component
Liquidity risk has also been found to be a major component of credit spreads. This is the specific focus of “Corporate Yield Spreads and Bond Liquidity” by Long Chen, David A. Lesmond, and Jason Wei. Like many researchers, they find that there is a stark difference in yield spreads between investment-grade and high-yield issues. From their results, a very rough estimate of liquidity spreads can be described. Specifically, their model concludes that the average liquidity spread for the investment-grade universe they utilized is 0.3181% and for the high-yield universe, 0.7804%. Comparing these findings with their average yield spreads across maturities for issues results in a liquidity yield spread premium of 16.83% for investment-grade issues and 7.09% for high-yield issues. The primary difference in the magnitude of the spreads comes from the average yield spread for the two bond-quality categories. Average yield spreads across maturities were 1.89% for investment-grade issues and a whopping 11.00% for high yield.
In the aforementioned paper “Dissecting Corporate Bond and CDS Spreads,” the researchers find that 53% of a credit spread is attributable to nondefault risk factors. Specifically, they find that 23% of credit spreads are due to differences in liquidity and that 30% of credit spreads are due to differences in taxation.
Accounting Transparency Risk Component
In “Accounting Transparency and the Term Structure of Credit Spreads,” Fan Yu finds that for high-quality credits, accounting transparency has very little effect on yield spreads. Low-quality credits with low accounting transparency, not surprisingly, have higher credit spreads on average. For securities coming due now that also have high transparency, yields are on average 31 bps lower. For transparent short-term securities (that reach maturity in Year 5), the reduction in yield is 11 bps. Transparent securities maturing in 10 years have a reduction in yield of 14 bps. Finally, long-term securities, in which maturity is in the 30th year, have yields that are a full 34 bps lower.
Yu’s universe of credits shows an average spread of 90 bps for securities maturing now. Thus, a very rough estimate of the amount of credit spread due to transparency issue can be calculated as 31 bps divided by 90 bps, which equals 34.4%. Yu specifically compares transparency risk to liquidity and taxation risk and finds them comparable.
Unfunded Pension Liabilities Risk Component
Given that unfunded pension liabilities are effectively shadow debt for a business, it would make sense that the greater the amount of these liabilities, the higher the credit spread. This was the hypothesis tested by Mirko Cardinale in “Corporate Pension Funding and Credit Spreads.”
Based on data contained in tables within the research, a weighted average spread across credit ratings classification and maturity is 2.14%. Across maturities, the average spread for investment-grade bonds in the sample is 1.25% and for high yield, 6.14%.
Cardinale uses regression analysis to estimate credit spreads, as if companies had no pension obligations. With this assumption, the spreads are found to be 1.27% for investment-grade issues and 4.41% for high-yield issues.
By taking the difference between the observed credit spread and the zero, unfunded pension obligations regression spread, an estimate for the effect of unfunded pension obligations on spreads can be determined. The difference, in this case, is approximately 0.0% (–0.02%) for investment-grade issues and 1.72% for high-yield issues, or 28.09% of the credit spread. For the entire universe considered by Cardinale, the percentage of the spread explained by unfunded pension obligations is 13.93%.
Political Business Cycle Risk Component
Steven A. Block and Paul M. Vaaler argue in “The Price of Democracy: Sovereign Risk Ratings, Bond Spreads, and Political Business Cycles in Developing Countries” that politicians manipulate economies in order to increase the likelihood of reelection in election years. These policies tend to drop the credit rating of developing economies by an average of one level during election years. Furthermore, credit spreads are wider in the lead-up to an election, with spreads narrowing postelection. On average, credit spreads are 0.22% higher in the three months preceding an election. Put another way, investors can reasonably expect credit spreads to widen in the run-up to an election as politicians put in place short-term economic stimulation policies.
Summary
Bringing all of this research together allows for the rough estimation of averages for each of the yield spread components. Here is a summary:
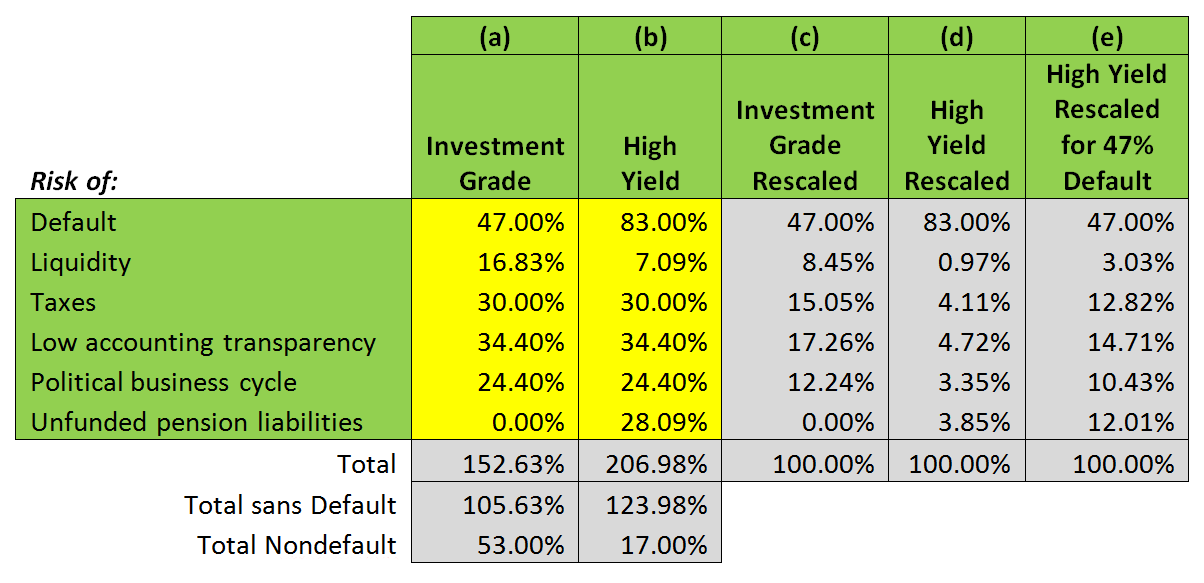
This table requires some explanation. First, many researchers rightly separate out their results for the two major categories of fixed-income investment grade and non-investment grade, (or high yield), and I have followed this methodology.
Second, yellow shading (Columns a–b) indicates the raw numbers found for spread components as a percentage of total credit spread from the research papers summarized earlier. Totals do not add up to 100% because different researchers tested for different components without necessarily accounting for all of the possible factors that other researchers were considering. What is needed is a rescaling of factors to account for the differences in findings (Columns c–e).
Complicating this, however, is the fact that many researchers have consistently found that default risk explains about half of a fixed-income issue’s credit spread. Thus, it seems to make sense to rescale all factors except for default risk, which seems to consistently fall at ~50%. But that creates still further complications: Longstaff, Mithal, and Neis find that default risk reflected in credit spreads for high-yield issues is much higher than 50%; specifically, it can reach as high as 83% for very low-quality debt. Consequently, in the chart the high-yield numbers are rescaled for two different default risk spread component levels: 83% (Column d) and 47% (Column e).
Most surprising to me is the low percentage of a credit spread that is attributable to differences in liquidity. As a former practitioner, I can testify to the frequent difficulty of finding liquidity in a trade versus the highly infrequent problem encountered from default. Perhaps a rule of thumb for the other factors is that they range, roughly, from 10 to 15%.
Hopefully these numbers will serve as a rough guide to fixed-income credit spread components and help you make better investment decisions. My own preference, and the one that I will carry around as part of my mental mosaic, is Column c for investment-grade issues and Column e for high-yield issues.
Businessman illustration from Shutterstock.
Originally published on CFA Institute’s Enterprising Investor.


0 Comments