


(Editor’s note: Today we’re delighted to introduce a new monthly column on the Calcbench blog that will explore financial analysis issues, written by Jason Apollo Voss — investment manager, financial analyst, and these days CEO of Deception and Truth Analysis, a financial analytics firm. Enjoy, and be sure to see our companion spreadsheet to help you explore the concepts Voss talks about.)
By Jason Apollo Voss, CFA
In today’s world where the biggest assets on the balance sheets of the most successful firms are all about intangible assets, you may wonder why people should still care about understanding property, plant, & equipment (PP&E) better and more deeply. The answer is twofold:
- Many firms play games with depreciation & amortization to improve their short-term results, and such games depend on PP&E.
- Even the biggest tech firms have big investments in hard assets.
In fact, from the details of PP&E disclosures you can draw numerous conclusions about growth capex and maintenance capex, two concepts crucial to financial analysts.
So let’s consider the two above points in turn, using Google (GOOG) and Apple (AAPL) as a compare-and-contrast case study.
Big Tech Firms’ Big Investment in Fixed Assets
Google reported 2020 total assets of $319.62 billion. That’s certainly impressive, and most of those assets must be intangibles such as goodwill, right?
Nope. Google’s total intangible assets, including goodwill, are just $22.62 billion — 7.1 percent of total assets. See Figure 1, below. Hmmm.
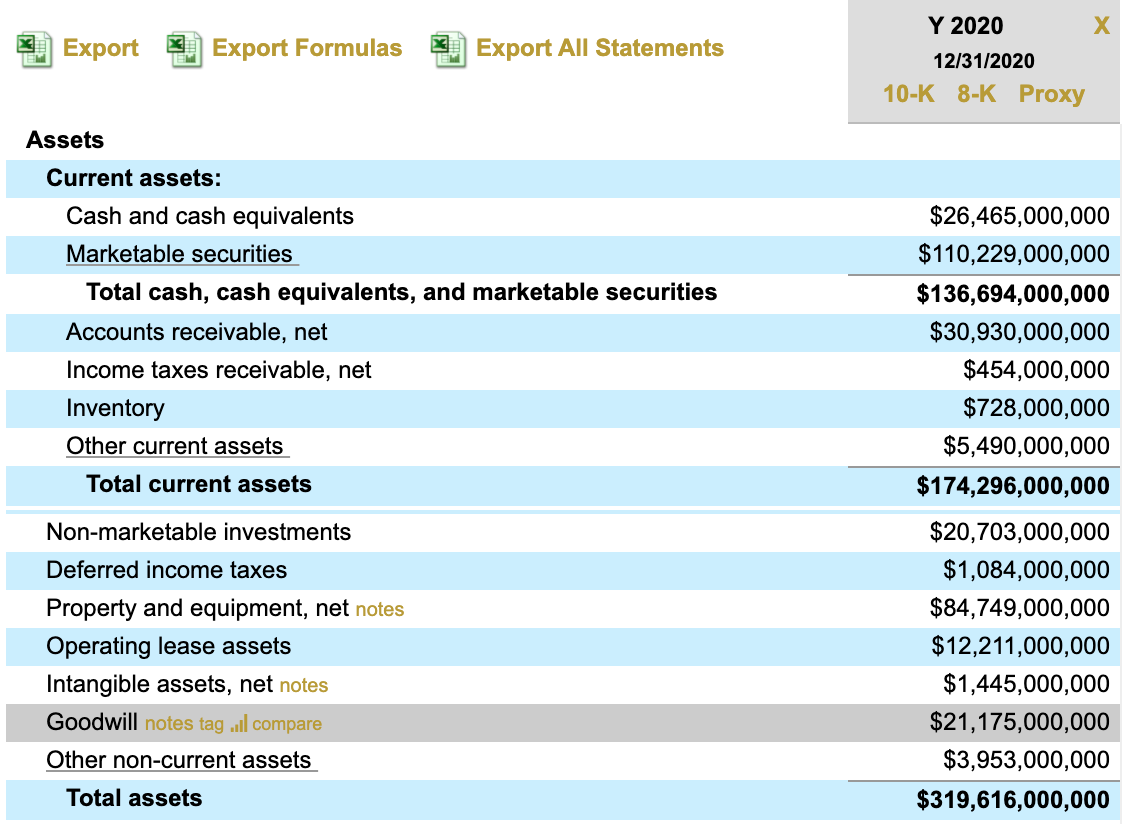
In contrast, gross property, plant, & equipment for Google is a whopping $126.46 billion, or 39.6 percent of total assets. In other words, Google’s fixed assets dwarf its intangible assets by a factor of 5.6. (Net PP&E, shown above, is “only” $84.749 billion.)
What about Apple? It outsources so much of its manufacturing, and the company is all about intellectual property. So surely its IP must dwarf its fixed assets, right?
Apple’s total assets for 2020 were $323.89 billion. Its IP assets were… um, hold on. Apple doesn’t actually report its intellectual property in detail, either on the balance sheet or in the footnotes. What’s that about?
First, a small digression. Apple’s intellectual property has to be its most important asset, and yet there’s almost no detail about it in the 10-K. As an investor, this kind of fog worries me. Essentially the company is saying, “Trust us, we are Apple.”
Back to the numbers. Apple does report an aggregate category named “Other Non-Current Assets.” In 2020 those assets totaled $42.52 billion, or 13.1 percent of total assets.
What bothers me is that things like deferred tax assets are also embedded in that number. So investors in Apple, likely enamored by its intellectual property, can’t actually get a direct read on the value of that IP.
Apple does disclose in its footnotes the size of its net deferred tax assets, which totaled $18.30 billion in 2020.
With this number, buried in the footnotes, we can then estimate that IP number indirectly. It’s likely to be Other Non-Current Assets ($42.52 billion) minus net deferred tax assets ($18.3 billion), which leaves us $24.22 billion for estimated intellectual property intangible assets, which is about 7.5 percent of total assets.
And what about Apple’s fixed assets? Those mundane Dickensian assets, the ones that surely don’t matter to investors?
In 2020 those assets totaled $103.53 billion — roughly 32 percent of total assets, and 4.3 times larger than estimated intellectual property intangible assets.
I think you see my point: the stories of Google and Apple ought to be enough to convince you as an investor that you should pay attention to the goings on within fixed assets, even in tech companies. That is, big tech needs BIGGER MECH.
PP&E Analysis Nuances
Because most firms provide only a single line item on their balance sheets about property, plant, & equipment, it’s difficult to determine whether the firm is keeping up with maintenance capital expenditures.
This is because depreciation is ultimately a cash expense, even though it’s typically treated as a non-cash expenditure. After all, you can only drive your car for so long without investing in repairs and maintenance before it no longer works. True, day in and day out the depreciation appears to be a non-cash expense — until the day that it isn’t. Ouch.
If an analyst is building a cash flow valuation model, he or she typically has a conversation with someone from the company in which they invest and asks for an estimate of maintenance capex. But we usually can estimate maintenance capex directly from the information reported in the annual report. We can also see how companies are aging their assets. Here’s how.
There are several PP&E metrics that you should know and incorporate into your fundamental analyses. Why? They lead to a more nuanced (read: higher probability of generating alpha) understanding of business performance. These metrics are:
- Average expected life of fixed assets
- Fraction of expected life exhausted
- Average remaining years =
(1-fraction of expected life exhausted × average expected life of fixed assets)
With these numbers you can do a magical thing: gain insight into how companies under-invest in fixed assets in the short run, to create the appearance of increased earnings and increased operating cash flow; and insight into underreported cash flows from/used in investing.
Average Expected Life of Fixed Assets Calculation
Here’s our first calculation, to determine average expected life of fixed assets.
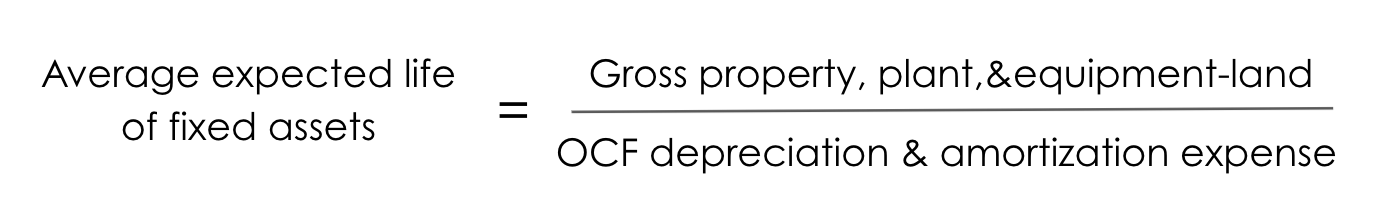
If you think about this formula it makes logical sense. Namely, if we want an estimate of how many years the fixed assets have left, we should take the total depreciable fixed assets and divide it by the amount taken most recently for depreciation and amortization. This gives us an idea of the average number of years of expected life.
Google, like most firms, has a single line item on its balance sheet labeled “Property & equipment, net.” But the net figure is distorted by accumulated depreciation, so we need the gross figure.
The numbers for gross PP&E and for accumulated depreciation are sometimes located on the balance sheet itself, or almost always in a footnote. In Google’s case for 2020, those amounts are found in “Footnote 7. Supplemental Financial Statement Information: Property and Equipment.”
In any case, the amount for Google in 2020 is $126.462 billion. But land is not a depreciable asset, so we need to subtract its value out of the gross property, plant, & equipment figure or else it will make the Average Expected Life of Fixed Assets figure too high. Again, the total value of land for Google in 2020 was reported as $49.732 billion.
Next, we need the depreciation & amortization expense figure for a single year. It’s located typically in one of the following places: the income statement (rarely), in a footnote somewhere (rarely), or on the cash flow statement in the operating cash flow category (almost always). For Google in 2020, that number is $12.905 billion.
With our figures in hand we can now calculate the average expected life of fixed assets for Google as:
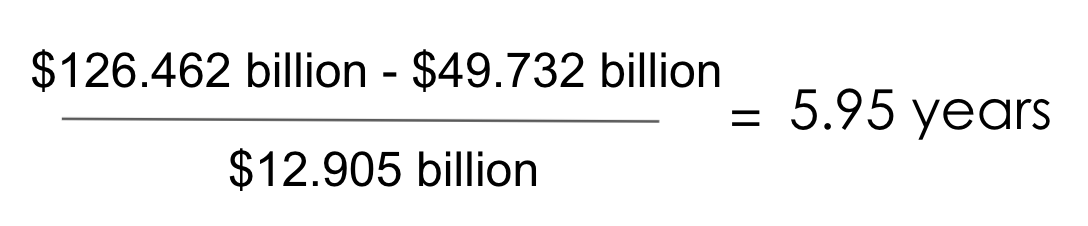
Before considering our next nuanced PP&E measure, we need to do a qualitative check. Does 5.95 years for Google’s depreciable fixed assets make sense? What are those assets exactly? Most likely, they’re office buildings owned by Google, as well as a massive investment in things like server farms.
One way to answer this question is to look at the composition of depreciable fixed assets in Google’s Footnote 7, and compare it to the company’s accounting policies regarding depreciation. We could even calculate a weighted average expected depreciation for Google. That’s outside the scope of this article, but it’s possible.
Fraction of Expected Life Exhausted
Here is how to calculate our next nuanced metric. Fraction of expected life exhausted equals:
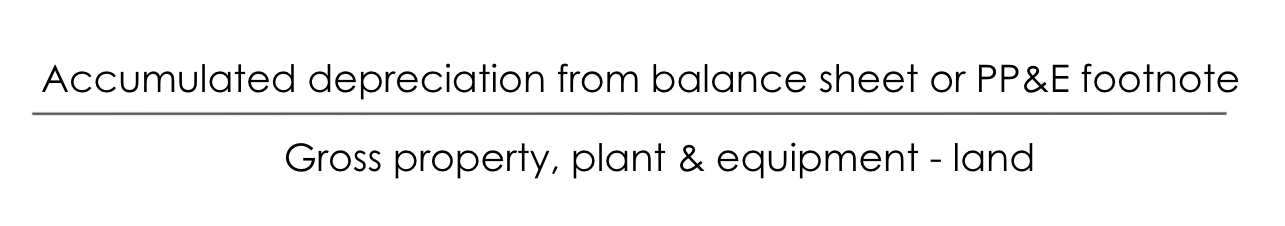
Again, this formula makes logical sense because it looks at the total accumulated depreciation over the years that the firm has owned its depreciable fixed assets; and then compares that number to the original purchase/book value of those assets. This is a reasonable estimate for how much of the depreciable fixed assets’ life has been exhausted.
For Google, this is calculated for 2020 as follows:
$41.713 billion ÷ $76.730 billion = 54.4 percent
In other words, while Google has booked assets that have an average expected life of 5.95 years, 54.4 percent of the value of those assets had been depleted by the end of 2020.
Average Remaining Years
Our next metric to calculate is average remaining years. It can be calculated as:
(1- fraction of expected life exhausted) x average life of fixed assets
In the case of Google, we can estimate that number as follows:
(1 – 54.4%) x 5.95 years = 2.71 years
The small number of years tells you something important. Namely, Google cannot afford to skimp on maintenance capex for too long before problems would likely start to emerge with key assets like servers.
Now, if we only had a way of estimating maintenance capex from our data…
Maintenance Capex
While the above figures were not created by me, to my knowledge the following maintenance capex estimate is my own creation. (Surely others have seen in the data a chance to estimate this key figure in valuation models.) Here’s the calculation:
Maintenance capex =
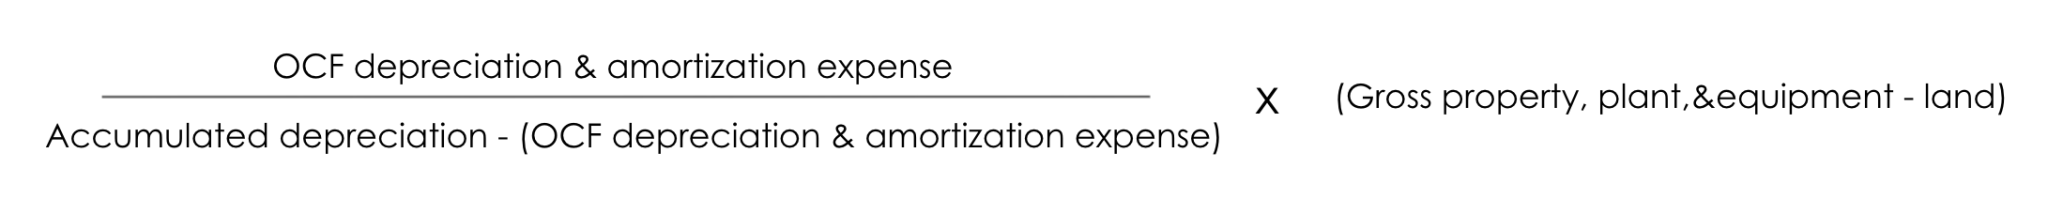
The innovation here is really not so tricky. If we’re trying to estimate this year’s maintenance capex spend, we cannot take this year’s depreciation & amortization expense because we need the total depreciable fixed assets from the beginning of the year. Consequently, in the denominator of the above equation, we add it back to the total accumulated depreciation for the firm.
For Google, it looks like this:

Voilà! But how does this compare to the actual capital expenditures (that is, purchases of property and equipment) taken by Google in 2020?
Well, Google reported $22.281 billion on its cash flow statement in its Investing Activities sub-section. If you are doing a valuation model for Google, and if you had calculated the above metrics in a time series, then you could independently (from management’s input) estimate the proportion of all capex that ought to be spent each year by averaging them together.
For the single year 2020 for Google, that figure is 81.4 percent. Wow! In other words, Google rapidly depletes its assets. This makes sense given that it is a tech company.
With the above figures you can also look at an interesting time series of over- or under-investment. If a company under-invests in maintenance capex, based on your estimate, it begs several questions:
- How sustainable is the underinvestment? Will the company’s competitiveness be hampered if it chronically underinvests?
- Why is it underinvesting in capex? Is management trying to deceive me into believing that the firm is performing better than it actually is?
But we can now infer another interesting conclusion from the above estimate for maintenance capex. Do you see it hidden in there?
We also now have an estimate for Google’s growth capex.
Growth capex can become the denominator in an interesting ratio (again, I think of my own invention):

Basically, this ratio looks at the marginal revenues generated by the growth capex spent a number of years ago. How many years? A good estimate for the number of years is the average of the time series of the average expected life of depreciable assets figures.
Next, as investors we should expect the maintenance capex figure to be lower than the total capex figure. But that isn’t always true. Let’s bring Apple back into the picture and compare it side by side with Google. Buckle up!
(Yes, the below image is a bit hard to read; Calcbench also has an Excel spreadsheet with the same formulas built into the model available for download, if you’d like to see other examples.)
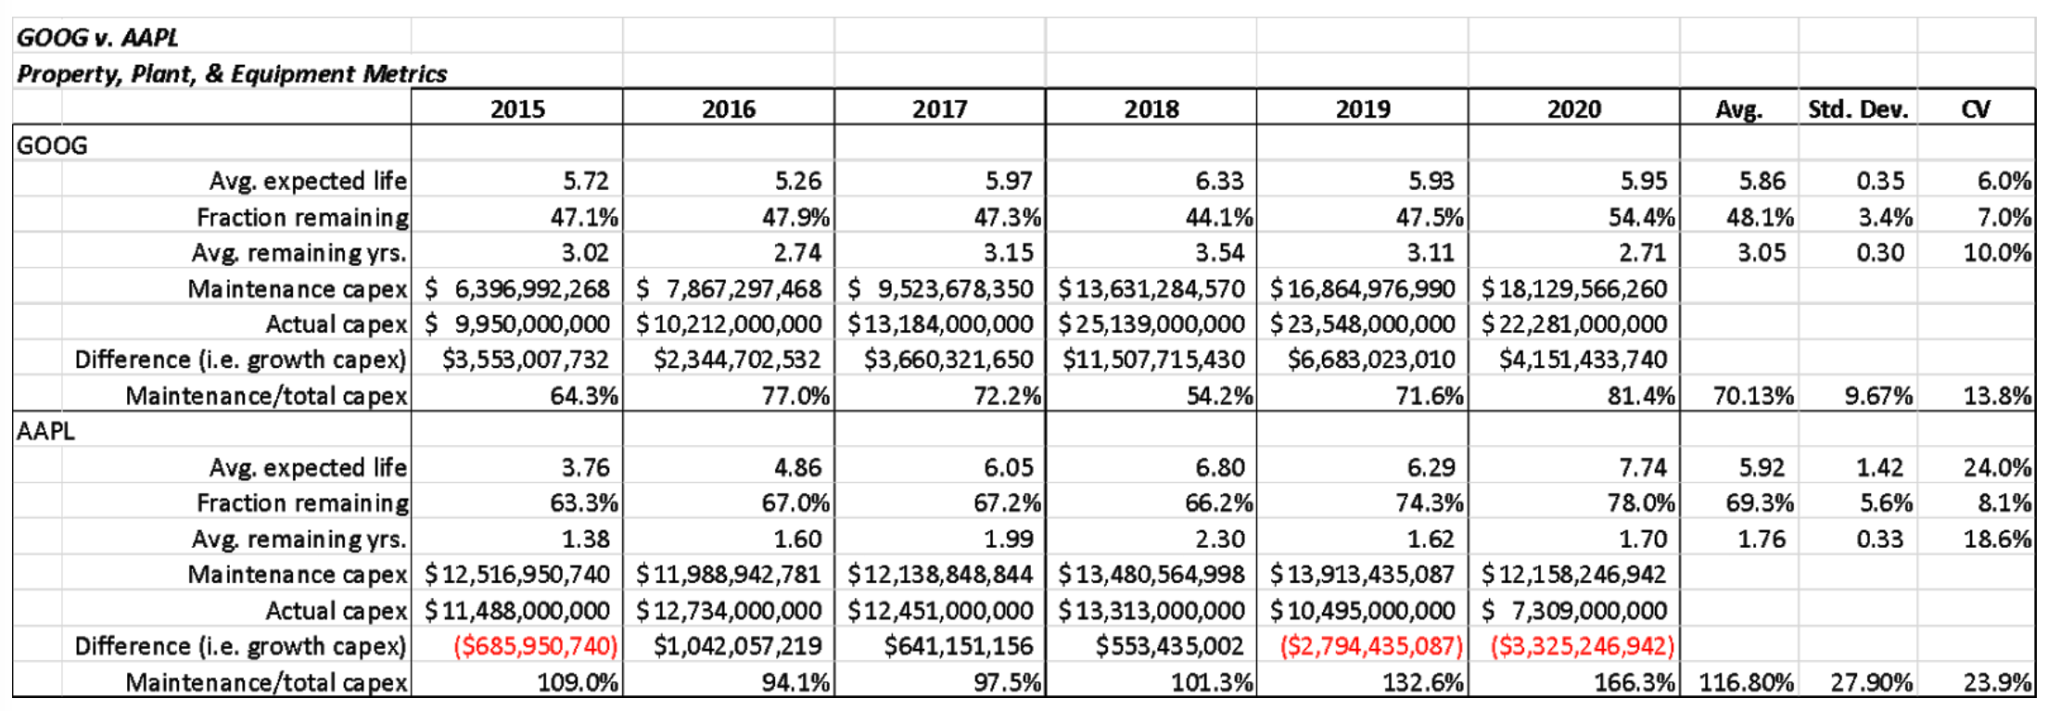
At a glance we can see several interesting things going on. In particular, note that Apple’s time series for these figures is more volatile than that of Google’s.
For example, Apple’s coefficient of variation (that is, standard deviation average) for its Average Expected Life figure is 24 percent, versus just 6 percent for Google. As investors, this is an indirect way to see that Apple’s business is likely more complex and slightly more volatile than that of Google’s.
Also noteworthy, and confusing, is that our estimate of maintenance capex for AAPL exceeds its actual capex. And we’ve been generous in these figures, because we are adding to total capex the value of Apple’s acquisitions. But Apple reports this figure “net,” meaning that its sale of businesses may be financing its capex — although we can’t say that for sure. Still, this is another example of not being able to decipher the full picture of what Apple is doing. Hmmm.
In my book, co-authored with C. Thomas Howard, Return of the Active Manager, I wrote about the behavioral insights that are embedded in financial statements. A hypothesis, I think, can be safely inferred from our deeper dive into Property, Plant, & Equipment Nuances. Namely, Apple needs higher scrutiny than Google, and Apple seems to behave in an obfuscating way.
Originally published by Calcbench, kindly reproduced with their permission.


Hi, thanks for sharing this article Jason.
Are there any resources you would recommend to learn more about Capex due diligence?
It is not very clear to me how to spot under/over investment here.
What do you make of D&A ~$12B vs $18B in maintenance capex in your example of Google?
In case of under/over investment in capex, would you adjust a valuation or offer price if acquiring a business?
Thanks
Hello Alex,
First, thank you for your comment and for reading my articles.
I am not aware of any extended resources on Capex due-diligence. In real estate investing there are resources about how to scope a property and its level of upkeep. But for more generalists, I am not aware of anything.
As for spotting under/over investment in terms of capex…these things are most obvious when you see several things in a time series happening in conjunction. 1) Typically either revenues slow, or expenses rise, thus, creating a pressure to temporarily underinvest in maintenance capex in order to hit earnings targets; and 2) you see a shift in the ratios discussed in the article. Obviously, an important consideration is the current operating environment of the company. Comparisons to competitors is also likely instructive.
What do I make of Google’s maintenance capex? That servers are very expensive and they become obsolete quickly.
In case of under/over investment in capex and the effect on valuation. This may sound like a technical question, but it isn’t. Just as you cannot under invest in automobile maintenance in the long-term, you cannot under invest in maintenance capex in most businesses, without outsized consequences later. A company that seems to be decelerating maintenance capex should be valued lower in anticipation of future higher cash outflows to restore the operating capacity of the business. Over investment in capex is going to show up in returns on assets, and in returns on invested capital, so there is likely less of a need for adjustment in the case of over investment.
With smiles,
Jason
Hi Jason, thanks clear answers thanks.
Indeed, under investing in CAPEX is just temporary. at some point you need to make those investments or your mahcines break, you become less competitive etc.
Something you have not touched on is the tax aspect of Capex and depreciation. It is a topic on its own…
Some companies would be more inclined to depreciating/amortizing quickly to limit their tax exposure (and sometimes the asset’s life far exceed it’s accounting life).
In tech it is often seen that when a PE acquires a tech company, the accounting practices change: some SW development will then be capitalized and amortized. A move done to lower the amounts of taxes to be paid…
I hope you are planning other posts in the same vein as this one as it is a very interesting one for sure.
thanks again for taking time to respond and have a good day ahead.
Hi Alex,
Thanks for your kind words. I really appreciate it 🙂
Your points about taxation and capex are each accurate and excellent. Thanks for placing them in the record 🙂
Alas, I am unlikely to post on accounting issues again anytime soon, simply because I am now working as the fulltime CEO of Deception And Truth Analysis, Inc. Our company measures the level of deceptiveness or truthfulness in almost any document, and we can show you where deceptiveness is the highest. If you are curious about these things point your browser over to…drum roll…deceptionandtruthanalysis.com
With smiles,
Jason